Google Analytics 4
Measures interactions across websites and apps so businesses can understand traffic, user behavior, events, conversions, audiences, and performance.
Google on GA4Every digital interaction creates information. Website visits, search impressions, advertising clicks, form submissions, purchases, calls, and customer behavior all produce signals about how your marketing is performing.
The value of analytics is not in collecting the largest possible amount of data. It is in building a measurement system that helps you understand what is happening, why it is happening, and what you should consider doing next.
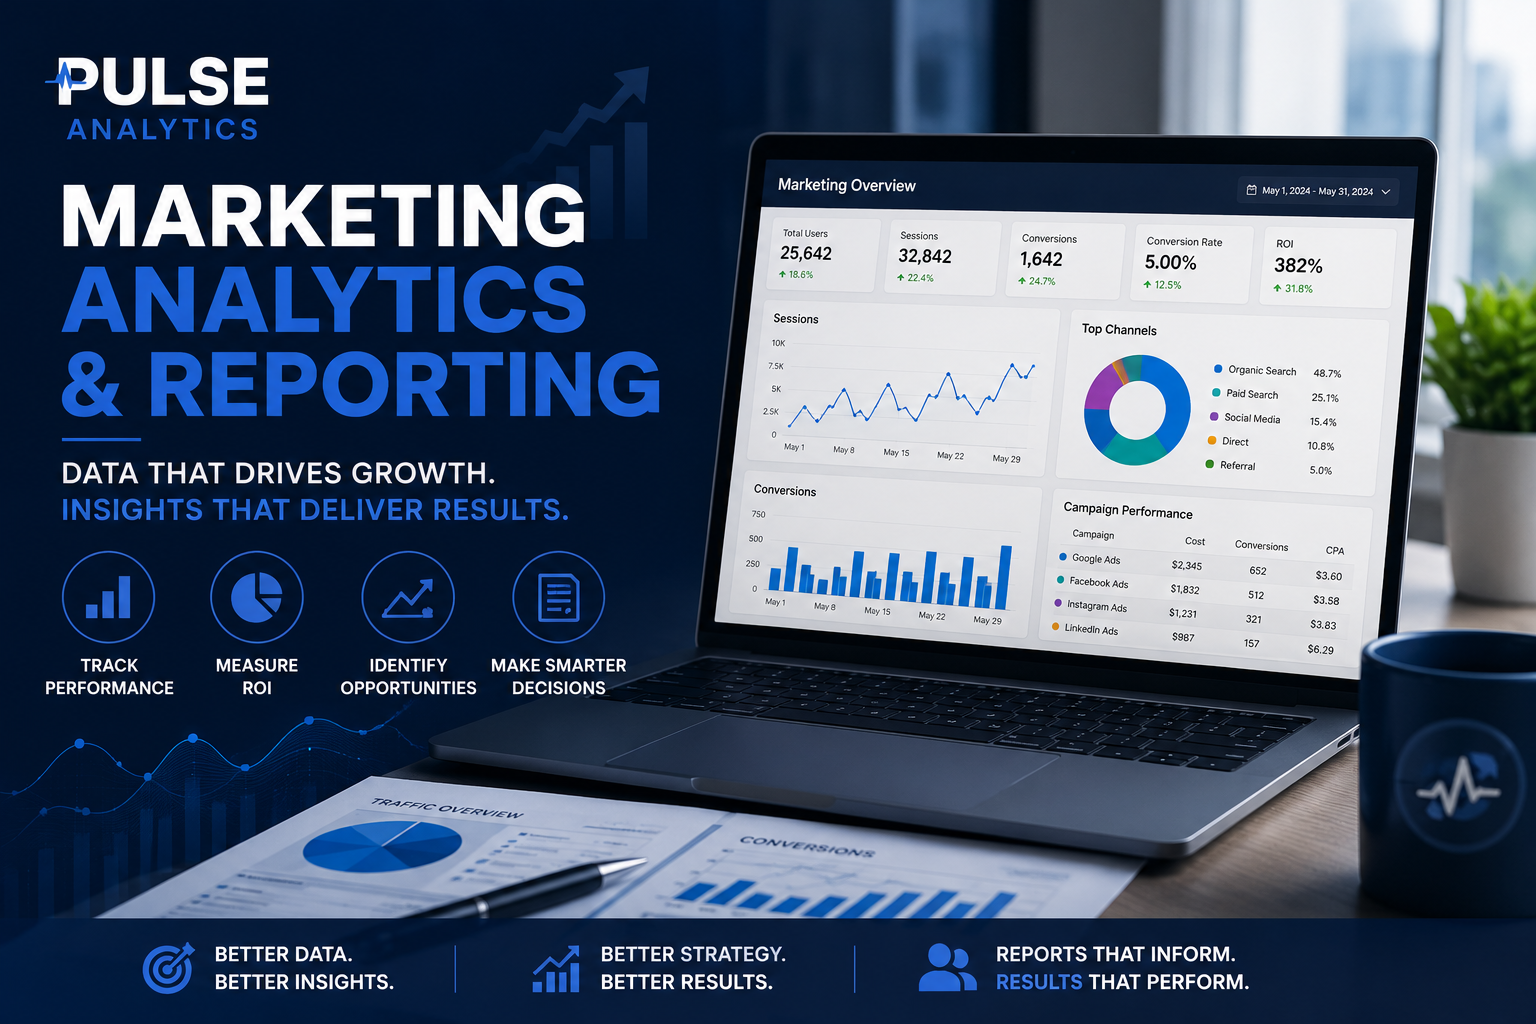
A business can generate traffic, run advertising, publish content, improve its website, and build an audience without knowing which activities are producing meaningful business outcomes.
Analytics provides the measurement layer that connects activity to outcomes. It helps businesses see patterns, evaluate performance, identify opportunities, and make decisions using evidence instead of assumptions.
Google describes Analytics as a platform for collecting data from websites and apps and using reports to gain insights about a business. Search Console adds visibility into how a site performs in Google Search, while Google Ads provides performance information about paid search activity. Together, these tools can provide complementary perspectives on the customer journey. Google Analytics documentation Google Search Console documentation
Modern measurement is not one platform. Each tool answers different questions, and the strongest systems connect those perspectives into a coherent measurement framework.
Measures interactions across websites and apps so businesses can understand traffic, user behavior, events, conversions, audiences, and performance.
Google on GA4Provides a system for managing tags, triggers, variables, and measurement code so tracking can be implemented and maintained more systematically.
Google on Tag ManagerShows how a website is performing in Google Search, including impressions, clicks, queries, indexing information, and technical search visibility issues.
Google on Search ConsoleMeasures paid search performance and helps businesses understand demand, clicks, conversions, conversion value, cost, and other campaign-level outcomes.
Google on Search CampaignsGoogle renamed Looker Studio to Data Studio in 2026. Data Studio turns connected data into customizable, shareable reports and dashboards that make performance easier to understand.
Google on Data StudioGoogle’s tagging framework can connect measurement destinations such as Analytics and Ads, while conversion measurement helps connect marketing activity to actions that matter to the business.
Google on the Google tagThe tools become more valuable when they are treated as parts of one measurement system rather than isolated dashboards.
Search impressions, queries, clicks, paid demand, and website traffic show how people are finding the business.
Events, engagement, navigation, audiences, and customer actions show what people do after they arrive.
Leads, purchases, calls, appointments, and other conversions connect activity to business objectives.
Analysis turns those signals into questions, priorities, recommendations, and opportunities for optimization.
A measurement system should help distinguish activity from results. The example below is intentionally illustrative—not a benchmark or forecast—to show how a measurement framework can connect a large number of interactions to the smaller number of actions that matter most.
Illustrative example only. Actual performance varies by business, channel, audience, offer, market, and measurement configuration.
Google Analytics 4 uses an event-based measurement model to help businesses understand activity across websites and apps. Its reports can be used to monitor traffic, investigate data, and understand users and their activity.
The important question is not simply whether GA4 is installed. The important question is whether the property is configured around the business questions you need it to answer.
The objective is to build measurement around meaningful customer actions—not simply accumulate metrics.
Google Analytics supports reporting and analysis across websites and apps. The quality of the resulting insight depends on the data collected, the configuration, and the questions being asked.
Tags send information, triggers determine when they fire, variables provide changing values, and the data layer can provide structured information for measurement.
Google Tag Manager is a tag management system that lets teams manage measurement and related code fragments through a centralized interface. Google documents its use with Google Analytics 4, Google Ads, conversion tracking, remarketing, and other tags.
A well-structured container can make measurement easier to maintain, troubleshoot, and expand. Poorly structured tagging can create duplicate data, inaccurate events, or difficult-to- diagnose reporting problems.
Search Console provides a view of how a website appears in Google Search. Google says it can help businesses monitor search performance, understand queries and clicks, identify indexing problems, and troubleshoot issues affecting search visibility.
For SEO and analytics, Search Console is especially valuable because it provides information about the search activity occurring before a visitor reaches the website.
Search impressions and clicks provide a different perspective from website analytics: they show what happens in Google's search environment before the visit occurs.
Google Ads provides campaign data that can help connect paid search activity to clicks, conversions, conversion value, cost, and other performance indicators.
Search advertising is most useful when the business can distinguish impressions and clicks from meaningful outcomes. Google identifies conversion rate, conversion value, cost per conversion, and return on ad spend among the metrics that can be used to evaluate Search campaign performance.
Search terms and search-category insights can also reveal what customers are actually looking for, giving marketers evidence that can inform targeting, creative, landing pages, budgets, and broader marketing decisions.
Google Data Studio—formerly known as Looker Studio—can connect to sources such as Google Analytics, Google Ads, Search Console, Google Sheets, databases, and other systems to create customizable reports and dashboards.
The objective is not to create a dashboard filled with numbers. It is to create a reporting environment where the right people can quickly see the metrics, trends, and relationships that matter to their decisions.
A good report reduces the distance between the question being asked and the information needed to answer it.
Analytics platforms are powerful, but access to a platform does not automatically create reliable measurement. Implementation requires technical understanding. Interpretation requires analytical judgment. Strategy requires an understanding of the business.
Pulse Analytics combines digital marketing knowledge, web development capability, measurement implementation, and formal Google Ads certification to approach analytics as both a technical and strategic discipline.
Certification claims should always reflect current, personally earned credentials. Additional platform certifications can be added as they are earned and remain active.
There is no universal dashboard that makes sense for every organization. A local service business may care most about calls, form submissions, directions, and qualified leads. An e-commerce business may care about revenue, transactions, product performance, customer acquisition cost, and return on advertising spend.
We help define measurement around the decisions the business actually needs to make.
A dashboard can look professional and still be built on incomplete, duplicated, or incorrectly configured data. That is why measurement quality deserves as much attention as visualization.
We consider implementation, event definitions, conversion logic, tagging, data consistency, access, documentation, and validation as part of the measurement system—not afterthoughts.
Check whether important events and conversions are firing as intended and whether the collected information makes sense.
Establish clear measurement definitions so the organization understands what its metrics mean and how they are produced.
Structure access and measurement practices responsibly, including attention to privacy, consent, and platform configuration.
Modern measurement exists within a changing environment of browser restrictions, privacy expectations, consent requirements, and platform policies. Google's own documentation emphasizes the importance of high-quality tagging and obtaining user consent where legally required.
We consider consent and data governance as part of measurement architecture rather than treating them as separate from analytics.
Review Google's guidance on tagging, privacy, and consentIdentify business objectives, customer actions, KPIs, and the questions the organization needs analytics to answer.
Configure Analytics, Tag Manager, Google tags, conversions, events, and other required measurement components.
Test tracking, review data quality, and identify implementation problems before relying on the resulting information.
Bring relevant data sources together so search, paid media, website behavior, and conversions can be considered in context.
Build clear reporting around the people who need the information and the decisions they are responsible for.
Use the evidence to identify opportunities, test changes, refine strategy, and improve performance over time.
Google Analytics, Search Console, and Google Ads each provide valuable information, but they do not answer every business question on their own. Customers can interact with a company through search, advertising, social media, email, referrals, direct visits, phone calls, and offline conversations before becoming a customer.
Attribution and connected-data analysis provide additional context by bringing relevant signals together. The objective is not to claim that every customer journey can be measured perfectly. It is to build a more useful view of how channels contribute to outcomes and where the measurement system still has limitations.
Good analytics makes the limits of the data visible while still producing information useful enough to guide better decisions.
The Google measurement stack can provide a strong foundation, but larger or more complex organizations may need information from additional systems. Depending on the engagement, analytics can be connected with CRM platforms, e-commerce systems, social advertising, email marketing, call tracking, spreadsheets, databases, and other business systems.
This is where analytics becomes business intelligence: bringing relevant information together so the organization can understand performance across the systems that influence growth.
Connect marketing activity with lead status, sales outcomes, and customer information when the available systems support that level of measurement.
Extend measurement into products, transactions, revenue, purchase behavior, and other commerce-specific outcomes.
Bring relevant paid, organic, social, email, referral, and direct signals into a broader performance framework.
SEO generates organic visibility. Google Ads captures paid demand. Social media creates engagement. Websites create customer experiences. Analytics provides the measurement layer that helps evaluate how those systems perform together.
That is why analytics sits at the center of our approach to digital marketing. Measurement does not replace strategy or experience—it gives strategy stronger evidence to work from.
If you are investing in marketing but cannot clearly explain where customers are coming from, which channels are performing, what is driving conversions, or where opportunities exist, your measurement system may be the missing piece.
Pulse Analytics Group can help build the infrastructure, reporting, and analytical framework needed to turn digital activity into information you can actually use.